Ocean Reliability on Routescanner
We’re excited to introduce Ocean Reliability in Routescanner. In this product explainer, we’ll walk through the methodology and show how reliability insights are integrated directly into your route comparisons.
Why reliability matters
In recent years, global ocean schedule reliability has hovered between 50% and 55%. This unpredictability can disrupt planning, increase costs, and cause inefficiencies across the supply chain. That’s why it’s now possible to view ocean reliability insights directly in your Routescanner search results, enabling smarter decisions when selecting carriers, planning shipments, or comparing container routes.
What you gain with Ocean Reliability
• Optimize Carrier Selection
Identify and compare carriers based on their historical reliability to improve predictability and reduce the risk of delays.
• Improve Planning & Inventory
More accurate ETAs allow for better coordination with warehousing, downstream logistics, and final delivery commitments.
• Benchmark & Negotiate
Use detailed performance data to compare service levels and support SLA negotiations, penalty clauses, and carrier selection during tendering.
How it works: step-by-step
This section outlines the process used to calculate and present ocean reliability insights.
Step 1: Schedule Tracking
Daily schedule updates from carriers are collected and archived. This allows changes in planned departure and arrival times to be traced over time.
Step 2: Vessel Monitoring via AIS
Each vessel is tracked in real time using AIS (Automatic Identification System) data, which provides live updates on position, speed, and direction.
Step 3: Port Event Detection
Defined port zones, or "polygons," determine when a vessel enters or exits a port. Each event is logged with:
• Actual Time of Arrival (ATA)
• Actual Time of Departure (ATD)
This enables global coverage of arrival and departure times for all monitored ports.
Step 4: Schedule vs. Reality Comparison
Historical schedules are matched with actual port events to generate reliability metrics, including:
• On-Time Arrival (OTA)
• On-Time Departure (OTD)
• Transit Time deviation
These metrics show punctuality at both ends of the journey and highlight differences between expected and actual lead times.
What sets this apart is the ability to uncover performance variation even when average transit times seem stable. Reliability data offers insight into:
• How consistently a carrier sticks to its schedule
• Which ports or regions experience recurring delays
• The reliability impact of different routing choices
Our methodology: measuring predictability
To reflect how shippers and forwarders actually plan, reliability is calculated using the schedule that was published 28 days before departure. This is the default benchmark in Routescanner.
From this benchmark, we define:
• On-Time Performance (OTP): Arrival and departure are considered on time when within ±1 day of the planned date
• Transit Time Accuracy: The difference in days between scheduled and actual duration
Visualizing Reliability on Routescanner
Reliability insights are integrated directly into both search results and detailed service views. For this walkthrough, the Maersk AE3 service from the Port of Rotterdam to the Port of Shanghai is used as an example.
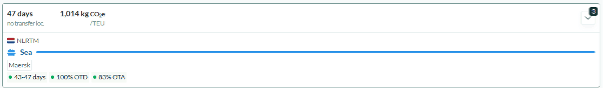
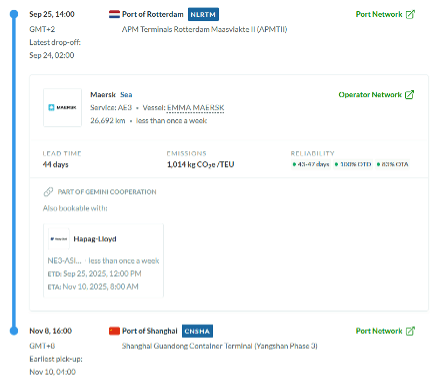
Search results and detail pages show three key indicators that give immediate insight into a carrier’s average performance across all iterations of a service.
In the Maersk AE3 example:
• 43–47 days: transit time range observed via AIS tracking
• 100% OTD: percentage of on-time departures
• 83% OTA: percentage of on-time arrivals
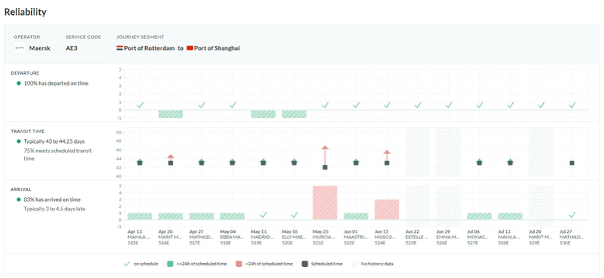
Details for each individual voyage are also available for deeper insight. Every service iteration is listed with:
• Departure date
• Vessel name
• Voyage number
• Performance indicators for departure, transit time, and arrival
Per iteration, the following is shown:
• Departure: Scheduled vs actual
• Transit Time: Planned vs actual duration
• Arrival: Scheduled vs actual
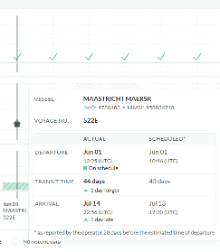
In this example, voyage 522E of the Maastricht Maersk departed as planned on June 1. The scheduled transit time was 43 days; the actual duration was 44 days. Arrival occurred on July 14, one day later than the planned arrival on July 13, resulting in a one-day delay.
Conclusion
Ocean Reliability adds a critical new dimension to your logistics planning toolkit. In addition to lead time, emissions, and network coverage, you can now also assess punctuality. Per carrier, per route, per service.
This means you're even better equipped to:
• Plan with more confidence
• Minimize risk across your network
• Base key decisions on concrete, data-driven insights
Ocean Reliability is now live. Contact us now to start leveraging it in your next Routescanner searches.
More from the blog

Schavemaker Logistics partners with Routescanner to enhance emission reporting

Hupac offers real-time insight into its rail network via an automatic schedule exchange.
Routescanner: your decision support platform
Stay in the loop
Discover how our network of shippers, forwarders, operators and terminals is growing.
Subscribe to our updates